|
A histogram is a graph which indicates how often certain data values occur in a file. Entropy is a measure of how random a file is and ranges from 0 (all one value) to 8 (completely random). Click the 'Tools > Histogram/Entropy' menu option to calculate the Histogram, Entropy or both for a file.

Histograms
A histogram is calculated by first interpreting the file as an array of data. Enable the Calculate Histogram toggle and select the data type for the array by selecting a value from the Treat Data As drop-down list (see Using the Inspector for more information on different data types). Then the histogram generates a number of buckets and places each value into a bucket depending upon its value. For example, the most common histogram treats the data as unsigned bytes and uses 256 buckets. Bytes in the file with value 0 are placed into the first bucket, bytes with value 1 are placed into the second bucket, etc. The graph generated indicates how many values were placed into each bucket.
Click the Options button to control the range and bucket configuration for the histogram. By default, 010 Editor generates 256 buckets to place values but the number of buckets can be modified using the Number of Buckets field. The minimum and maximum accepted values can be edited by modifying the Minimum Value and Maximum Value fields respectively. The values that each bucket holds is calculated by dividing the range specified by the minimum and maximum values into Number of Buckets equal intervals. Any values in the file outside the minimum and maximum values are ignored in the histogram calculation.
If no selection is made on the file, the Histogram will be run on the entire file. If a selection is made, select the Selection toggle to calculate the histogram based only on the selected bytes (the default), or select Entire File to calculate the histogram on all bytes in the file.
Histogram Output Window
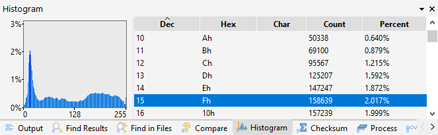
The result of the histogram will be shown in the Output Window. On the right side of the window is a table of all the different buckets (see above for an explanation of the buckets). The Dec, Hex, and Char fields indicate the values in a particular bucket in different formats. The Count field indicates the number times a value was placed into a bucket and the Percent field indicates the percentage of all the values that were placed into the bucket. Note that the Char field will display characters using the character set of the current file if the file is using a simple character set; however, if the file is using a more complex multi-byte character set such as UTF-16, UTF-8, or Chinese, this field will just display ASCII values. The table can be sorted by clicking on one of the field headings.
A graph is displayed in the left area with percentage running along the vertical axis and value running along the horizontal axis. A blue bar indicates the percentage of each value. Selecting a bucket in the output table will highlight the corresponding bar as yellow in the graph. To clear the histogram, right click on the Output Window and select 'Clear'. Press the Esc key in the Output Window to hide the window.
Entropy
Entropy is a measure of how random a file is and ranges from 0.0 if all values are the same, to 8.0 if the all values are completely random. This is also called Shannon Entropy and is calculated using the formula:
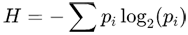
where pi gives the probability that each value has of occurring in the file. Calculating the entropy provides a fast way to determine what type of data a file stores. Typical ranges for different types of files are as follows:
- Text Files: ~3.5 to 5.0
- HTML, XML: ~4.0 to 5.5
- ZIP, JPEG, MP3: ~7.5 to 7.99
- Encrpyted: ~7.99 to 8.00
- Empty file: 0.0
Enable the Calculate Entropy toggle to compute the entropy for a file. If a selection has been made, enable the Selection toggle to only consider the bytes in the selection. Usually the entropy is calculated for a whole file but a single file may contain multiple types of data. It is useful to divide the file into a series of blocks and calculate the entropy separately for each block. By default, the file is split into blocks of 512 bytes but the size can be specified using the Block Size field. To order to prevent using too much memory, a maximum number of blocks is listed in the Maximum Blocks field. Typically entropy is calculated by treating the data as Unsigned Bytes but the data can be treated as other types of data using the Treat Data As field and by adjusting the number and size of each bucket in the Options section. Click the OK button to calculate the entropy.
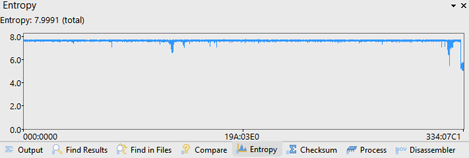
Entropy Output Window
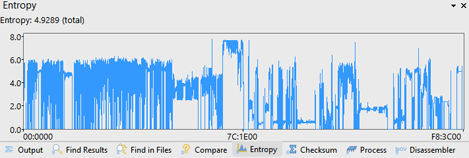
The resulting Entropy is shown in the Output Window and the total file entropy is listed at the top after the Entropy: label. A graph shows the entropy of each block. The above graph shows an EXE file that contains sections with entropy close to 8.0 (embedded images) and low entropy close to 0.0 (empty areas). Placing the mouse over the graph shows 5 different values: the range of the entropy of all the blocks the mouse is over, the starting address of the first block the mouse is over, the block size in bytes, the number of blocks the mouse is over, and the total number of blocks. Clicking on the graph will select all the blocks that the mouse is over.
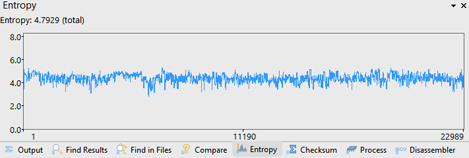
Different types of data can be determined from the graph. The above graph shows source code.
The above graph shows a ZIP file and note the block of uncompressed data at the end of the file. Pressing the Esc key hides the Output Window.
|